Please note that csvplot source code is now moved to GitHub. Source code can be downloaded from the project’s GitHub page.
Purpose
I do software prototyping using a wide range of programming language. I often have to generate data that changes over time which is mostly displayed in a grid format. However, that’s not the best way to understand how the data changes over time compared to plotting the data to a graph.
Most programming language I know does not offer a native library for plotting data to a graph. It is not an easy task. Most programming language often require external libraries for implementing the process and each library does not work the same way.
Excel is a native platform for parsing Comma-separated values (CSV) files and can be scripted to plot the result into an image.
The purpose of this script is to allows any programming language which generates data to plot the data into an image by saving the raw data to a CSV file and then using the power of Excel to plot the result into an image.
Skip to the download section for quick download.
Note that csvplot is only available for Windows and has been tested on Windows 7 only.
Features
The following section list the features of csvplot script:
- Supports lossless PNG image format.
- Supports CSV data file format which is a generic text file format supported by any application and programming language.
- The script supports virtually an unlimited number of time series plots.
- Automatically detect appropriate boundaries for the graph
Limitations
The script has some limitations which are explained here.
Output image
The resolution of the output image may be +- 1 pixels different than what is requested on command line. This is a limitation of how Excel processes image dimensions since it uses “points” as base unit and not actual pixels. A conversion from pixels to points must be calculated which may contains small accuracy error.
The only supported image format is PNG. It is still unknown if Excel actually support JPG for exporting graphs but PNG seems to be the perfect candidate since its a lossless compressed format.
Column Titles
It is expected that first row of each column contains the title of the column which will be used as the name of the plotted series within the graph.
Usage
The command for launching the script is as follows. The script must be called with a minimum of 6 command line arguments.
| Name | Description |
|---|---|
| InputFile | Path of the input CSV file |
| OutputFile | Path of the output PNG image |
| Width | Width of the output image in pixels |
| Height | Height of the output image in pixels |
| Serie #1, X column | X column index of first series |
| Serie #1, Y column | Y column index of first series |
| Serie #2, X column | X column index of second series |
| Serie #2, Y column | Y column index of second series |
| Serie #n, X column | … |
| Serie #n, Y column | … |
Note that column indice are 1-based and not 0-based. This means that column A is column 1 and not column 0.
Execution (command line)
The script is written in VBScript. Use the following to execute the script from a batch file (*.bat) :
@echo off
cscript //nologo "%~dp0csvplot.vbs" path\to\demo.csv path\to\demo.png 800 600 1 2
pause
Output
On execution, the following output is produced by the script:
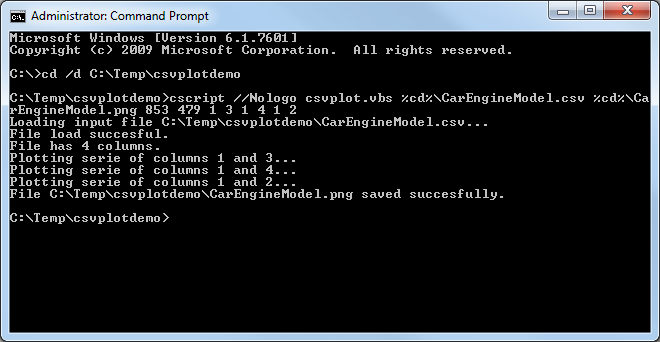
Microsoft Windows [Version 6.1.7601]
Copyright (c) 2009 Microsoft Corporation.  All rights reserved.

C:\>cd /d C:\Temp\csvplotdemo

C:\Temp\csvplotdemo>cscript //Nologo csvplot.vbs %cd%\CarEngineModel.csv %cd%\CarEngineModel.png 853 479 1 3 1 4 1 2 Loading input file C:\Temp\csvplotdemo\CarEngineModel.csv...
File load successful.
File has 4 columns.
Plotting series of columns 1 and 3...
Plotting series of columns 1 and 4...
Plotting series of columns 1 and 2...
File C:\Temp\csvplotdemo\CarEngineModel.png saved successfully.

C:\Temp\csvplotdemo>
Code
The code below can be downloaded by clicking on the following link:
Please note that download links are now deprecated. Binary version of csvplot can be downloaded from the project’s Release page.
Samples
The following section shows some example of using cvsplot to plot a series
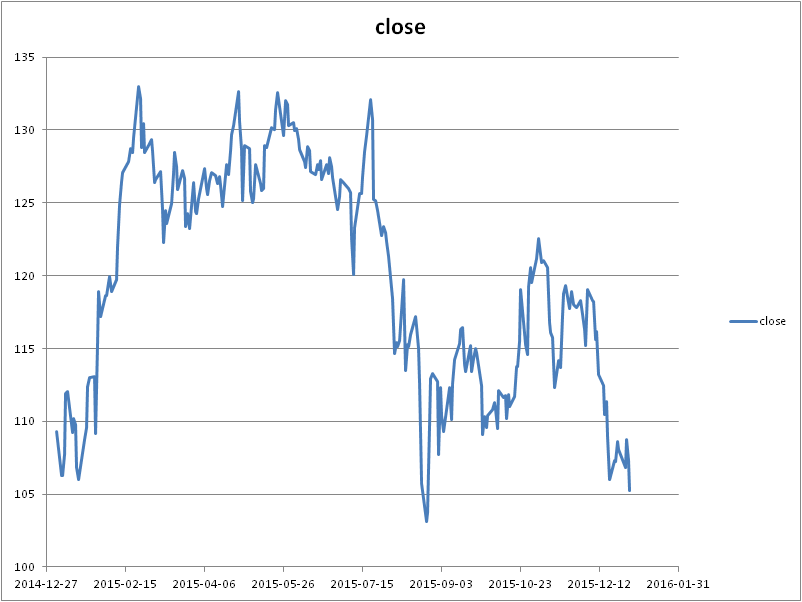
Apple Share Prices
The following example show the Apple Share Prices closing value over the year 2015. The data is provided by Nasdaq at the following address: http://www.nasdaq.com/symbol/aapl/historical.
The CSV data can be downloaded here: Apple-Share-Prices-over-time-2015.csv
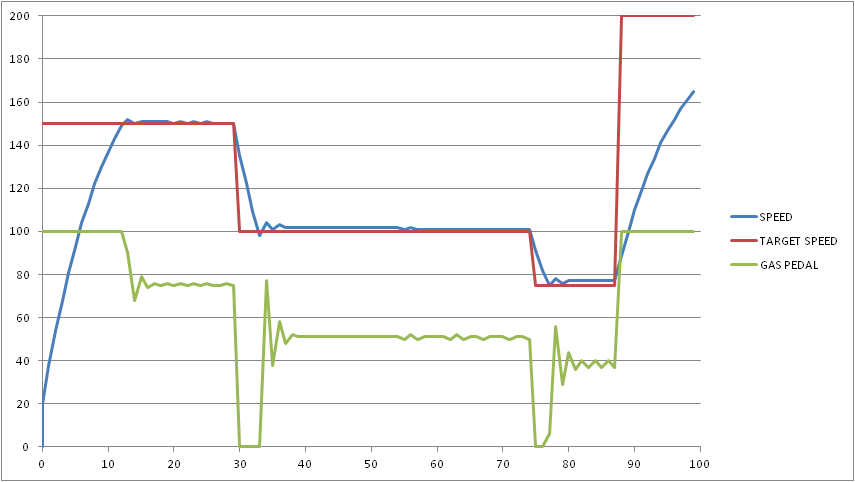
Car Engine Model
The following show a hypothetical car engine model which speed increase of decrease over time based on the feedback of the gas pedal.
The CSV data can be downloaded here: CarEngineModel.csv
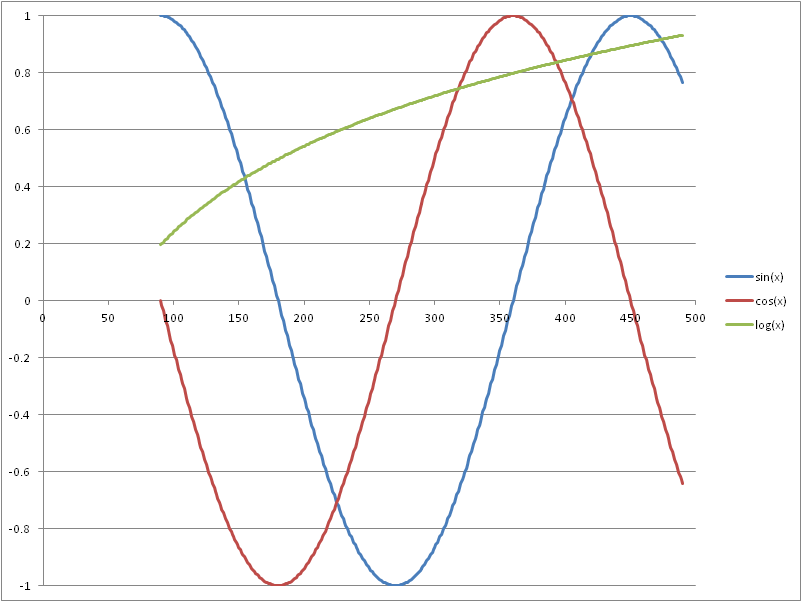
Sin(x), Cos(x) and Log(x)
The following show a graph of sin(), cos() and log() function in Excel.
The CSV data can be downloaded here: sinxcosxlogx.csv
License
Copyright (C) 2016 Antoine Beauchamp
This library is licensed under the MIT License:
A short and simple permissive license with conditions only requiring preservation of copyright and license notices. Licensed works, modifications, and larger works may be distributed under different terms and without source code.
The full license is available here.
Download
You can download csvplot by clicking on the following link:
Please note that download links are now deprecated. Binary version of csvplot can be downloaded from the project’s Release page.


Comments